Cardiac Output Explained
Cardiac output is the amount of blood pumped by the heart each minute. It provides a snapshot of how effectively the heart meets the metabolic demands of the body and is a key indicator of cardiovascular performance. Cardiac output is influenced by heart rate and stroke volume, both of which change in response to activity, emotional stress, illness, and medications. When cardiac output increases, blood pressure rises; when cardiac output falls, bloods pressure falls. Understanding cardiac output is essential for interpreting shock, heart failure, fluid balance, and responses to treatment.
What You Need to Know
The cardiac output equation is:
Cardiac Output = Heart Rate × Stroke Volume
CO = HR x SV
Heart rate (HR) is the number of beats per minute. Stroke volume (SV) is the amount of blood ejected from the left ventricle with each beat. SV can be measured by a number of techniques, including:
Echocardiogram (most common and non-invasive)
Cardiac MRI
Cardiac catheterisation
Arterial waveform analysis (estimates SV)
A normal cardiac output is roughly 4–8 litres per minute, depending on body size and activity level. Stroke volume is influenced by three main factors:
Preload (the amount of blood in the ventricle before contraction)
Afterload (the resistance the ventricle must overcome to eject blood)
Contractility (the strength of the heart's contraction)
Preload increases with higher venous return and enhances stroke volume through the Frank–Starling mechanism. Afterload increases with arterial resistance, as seen in hypertension. Contractility increases with sympathetic stimulation and decreases in conditions such as myocardial infarction or cardiomyopathy.
Beyond the Basics
Dynamic Regulation of Cardiac Output
Cardiac output is not a fixed value, but a continuously adjusted variable that responds to changes in activity, posture, and physiological stress. The autonomic nervous system plays a central role in this regulation. Sympathetic stimulation increases heart rate, enhances myocardial contractility, and accelerates atrioventricular conduction, allowing the heart to pump more blood per minute during periods of increased demand. This coordinated response ensures that working muscles and vital organs receive adequate oxygen and nutrients during exercise or acute stress.
Parasympathetic influence, controlled primarily through the vagus nerve, predominates during rest and sleep. Vagal tone slows the heart rate and reduces atrioventricular nodal conduction, lowering cardiac output when metabolic demand is reduced. This state conserves energy and allows myocardial recovery, highlighting that reduced cardiac output in resting states is a normal and adaptive response rather than a sign of dysfunction.
Preload, Venous Return, and the Frank–Starling Mechanism
Stroke volume is strongly influenced by preload, which results from the degree of ventricular filling at the end of diastole. Venous return (the blood coming back to the heart) determines preload, making cardiac output highly sensitive to circulating blood volume and venous tone. The Frank–Starling mechanism explains how increased ventricular filling stretches myocardial fibres, enhancing contractile force and increasing stroke volume within physiological limits. Essentially, the more the heart fills with blood, the more the muscle stretches, which makes it contract more strongly and pump out more blood, up to a certain limit. Think of an elastic band stretching and snapping back with more force the more it’s stretched.
When preload falls, as in dehydration or haemorrhage, reduced ventricular filling leads to a drop in stroke volume and cardiac output. Baroreceptor-mediated sympathetic activation attempts to compensate by increasing heart rate and peripheral vasoconstriction, but this compensation is often limited if volume loss is significant. Conversely, increased preload from fluid administration or renal sodium and water retention can raise stroke volume and output initially, but excessive preload places strain on the ventricles and raises filling pressures. Similarly, an elastic band will not snap back as effectively if it is overstretched.
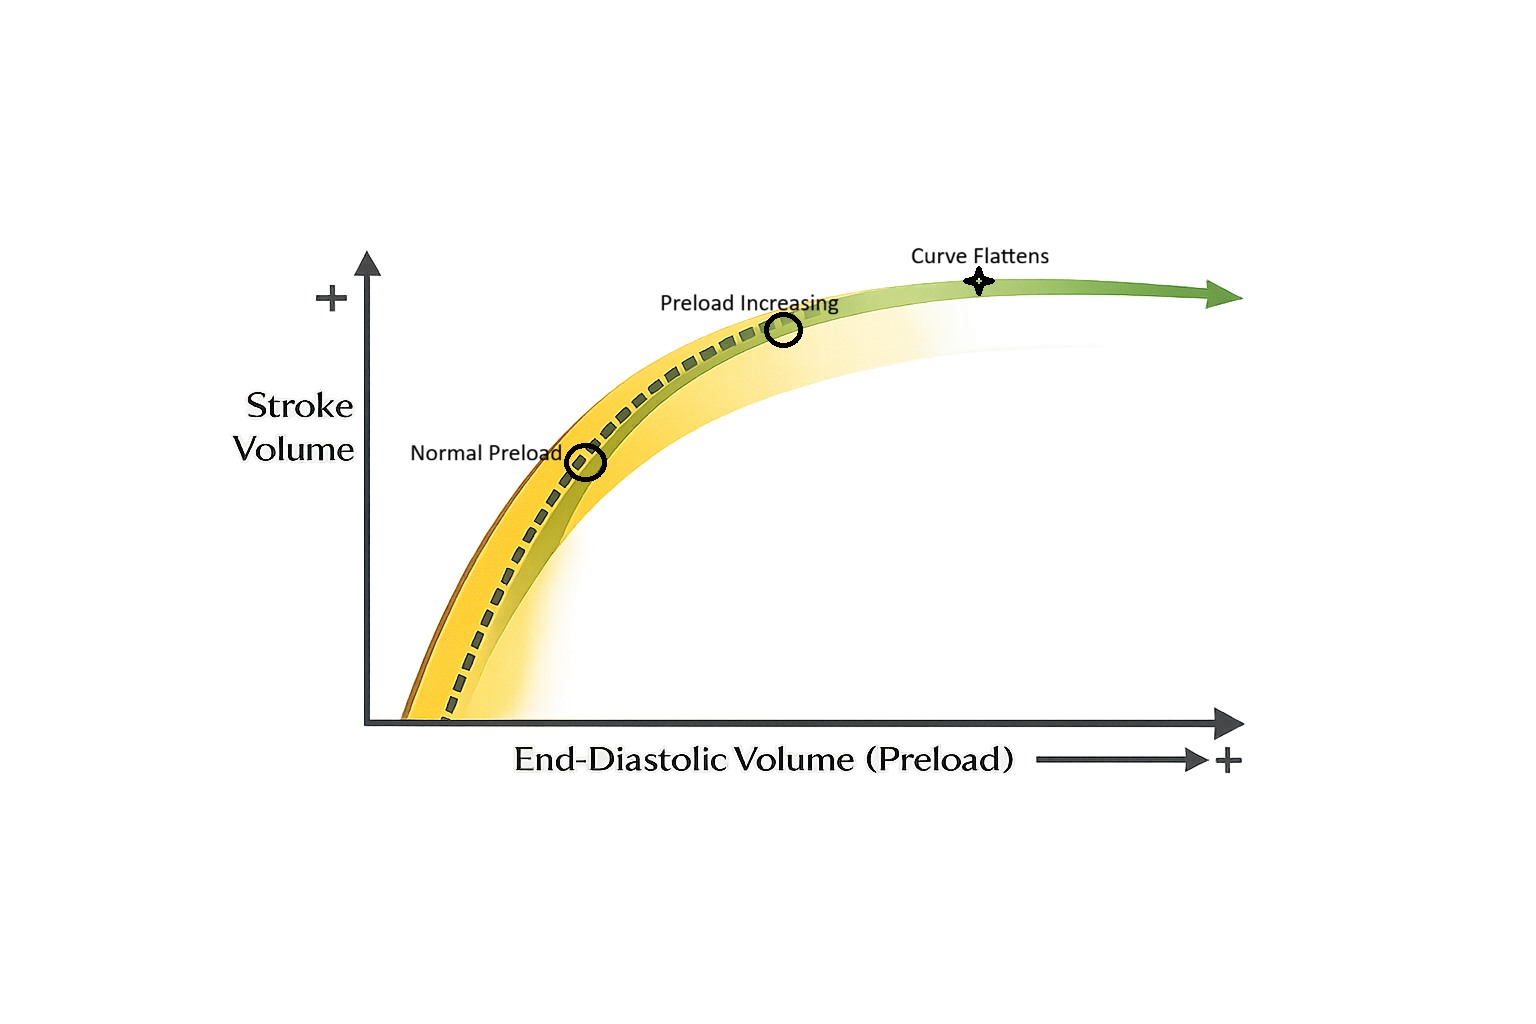
Image: The Frank-Starling mechanism. The ascending limb (dotted line) represents optimal stretch, the “fluid responsive zone”. There is limited benefit of further fluids where the curve plateaus.
As preload increases, stroke volume initially rises as ventricular filling improves contraction. Beyond a certain point, further increases in preload produce little additional increase in stroke volume, resulting in flattening of the Frank–Starling curve.
Fluid Balance and Cardiac Performance
Fluid status has a direct and immediate impact on cardiac output, particularly in patients with compromised cardiac function. In healthy hearts, moderate increases in preload are well tolerated and improve output. In contrast, in conditions such as heart failure, the ventricle operates on the flatter portion of the Frank–Starling curve, meaning additional preload produces little increase in stroke volume while markedly increasing venous and pulmonary pressures.
This mismatch explains why fluid overload can precipitate pulmonary oedema despite an initially normal or only mildly elevated cardiac output. Elevated left-sided filling pressures transmit backward into the pulmonary circulation, leading to transudation of fluid into the alveoli and impaired gas exchange.
Afterload and Vascular Resistance
Afterload is the resistance the ventricle must overcome to eject blood. Systemic vascular resistance (SVR) (resistance to blood flow from the systemic vasculature) is the major determinant of afterload for the left ventricle. Acute increases in afterload, such as during hypertension or vasoconstriction, reduce stroke volume and cardiac output by increasing myocardial workload and oxygen consumption.
Afterload is often likened to the pressure in a hose- the higher the pressure, the harder the heart has to pump to get blood out. Afterload is the pressure the heart pumps against when ejecting blood. Higher afterload means the heart works harder to push blood forward.
Reducing afterload improves forward flow by lowering the pressure against which the heart must pump. This is particularly beneficial in patients with impaired systolic function (chronic conditions that damage the myocardium, such as acute coronary syndrom (ACS), cardiomyopathy, valve disease and hypertension), where even small reductions in afterload can significantly improve stroke volume and cardiac efficiency. The balance between maintaining adequate blood pressure and optimising cardiac output is therefore a key aspect of cardiovascular regulation.
Pharmacological Modulation of Cardiac Output
Medications can alter cardiac output by targeting its individual determinants. For example, positive inotropes increase myocardial contractility, improving stroke volume and output in states of reduced cardiac performance. These agents enhance calcium availability within cardiac myocytes, strengthening each contraction without necessarily increasing heart rate.
Vasodilators primarily act by reducing afterload and, in some cases, preload. By decreasing systemic vascular resistance, they facilitate ventricular ejection and improve forward flow. Beta-blockers, in contrast, reduce heart rate and contractility, lowering myocardial oxygen demand and workload. While this may initially reduce cardiac output, long-term use improves ventricular filling time and cardiac efficiency in chronic conditions.
Integration and Homeostatic Balance
The regulation of cardiac output results from the integration of neural, mechanical, and pharmacological influences. Heart rate, stroke volume, preload, afterload, and contractility interact continuously to match cardiac performance with physiological demand. Disruption in any one component often triggers compensatory responses in others, preserving perfusion in the short term. This dynamic balance allows the cardiovascular system to respond rapidly to changing conditions while maintaining stability at rest. Understanding these interactions shifts knowledge beyond isolated numbers and highlights cardiac output as a responsive, finely tuned system rather than a single measurable number.
Clinical Connections
Cardiac output is one of the most clinically important determinants of tissue perfusion and oxygen delivery. When cardiac output falls, organs become hypoxic even if blood pressure and oxygen saturation appear normal. Patients may present with fatigue, confusion, cool peripheries, reduced urine output, and rising lactate as tissues shift toward anaerobic metabolism.
Low cardiac output states are common in:
Heart failure, where impaired contractility or filling limits stroke volume
Myocardial infarction, where damaged myocardium cannot generate adequate force
Hypovolaemia, where reduced preload limits ventricular filling
Septic shock, where abnormal vascular tone and capillary leak reduce effective forward flow
In these situations, blood pressure alone is an unreliable indicator of perfusion. A patient may maintain a “normal” blood pressure through vasoconstriction while cardiac output remains dangerously low.
High cardiac output can also be pathological. In conditions such as sepsis, severe anaemia, hyperthyroidism, pregnancy, or arteriovenous fistulae, cardiac output rises to meet increased metabolic demand or compensate for reduced oxygen delivery. Although total flow is high, tissues may still be poorly perfused because of maldistribution or low systemic vascular resistance.
Cardiac output can be measured using invasive and non-invasive monitoring techniques, depending on the clinical setting.
Pulmonary artery catheter (thermodilution method)
Arterial waveform analysis systems (e.g. FloTrac)
Echocardiography (ultrasound-based estimation)
Doppler techniques (e.g. oesophageal Doppler)
Non-invasive cardiac monitoring (e.g. bioimpedance or bioreactance)
Monitoring trends in heart rate, blood pressure, urine output, mental status, lactate, and peripheral perfusion provides insight into whether cardiac output is adequate, even when traditional vital signs appear stable.
Concept Check
How do preload, afterload, and contractility each affect stroke volume?
Why does dehydration reduce cardiac output?
How does sympathetic activation change heart rate and stroke volume?
Why might a patient in sepsis have a high cardiac output initially?
What clinical signs suggest low cardiac output?
🔗Explore related articles: