The Electrocardiogram (ECG): Electrical Activity of the Heart
The electrocardiogram (ECG) is a non-invasive tool that records the electrical activity of the heart. It provides essential information about heart rhythm, conduction pathways, chamber enlargement, and signs of myocardial ischemia and infarction. Although an ECG tracing may appear simple, it represents complex physiological processes that coordinate each heartbeat.
*This article explains the physiology behind an ECG, explanations on how to interpret an ECG will be covered in the Clinical Connections section.
What You Need to Know
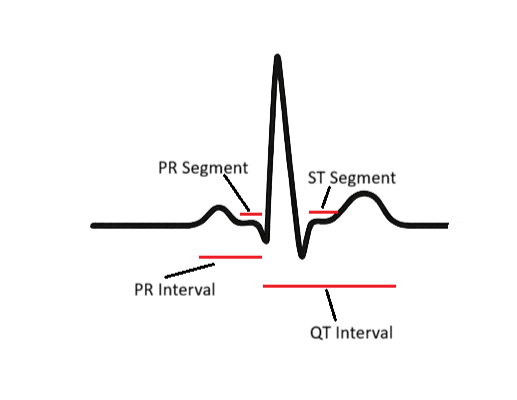
Each component of the ECG corresponds to a specific electrical event. The P wave represents atrial depolarisation, which triggers atrial contraction. The PR interval reflects the time taken for impulses to travel from the atria to the ventricles via the AV node, a brief delay that ensures the ventricles have time to fill. The QRS complex represents ventricular depolarisation, initiating ventricular systole. Because ventricular muscle mass is large, the QRS is tall and sharp.
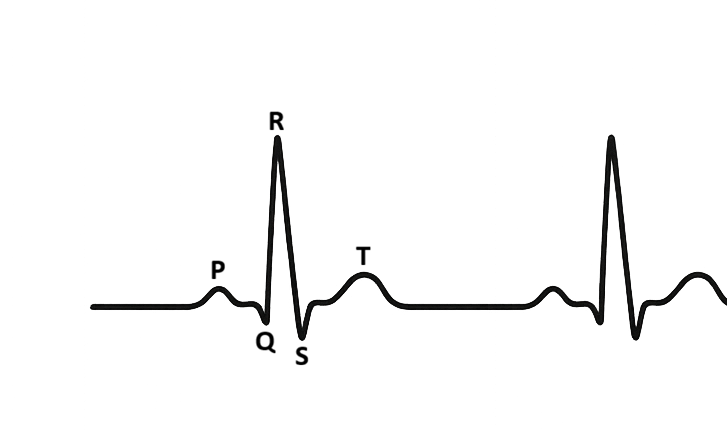
The ST segment is an electrically neutral period corresponding to the plateau phase of ventricular contraction. The T wave represents ventricular repolarisation, the resetting of electrical activity before the next beat. In a healthy heart, the intervals between these waves remain consistent. Disruption to any part of this pattern suggests conduction abnormalities, electrolyte imbalances, or myocardial injury.
P wave
Start: first upward (or downward) deflection from baseline
End: return to baseline before the QRS
PR segment (Represents AV nodal delay)
Start: end of the P wave
End: start of the QRS complex
PR interval
Start: start of the P wave
End: start of the QRS complex
QRS complex
Start: first deflection from baseline after the PR interval (Q or R wave)
End: return to baseline after the S wave
ST segment
Start: end of the QRS complex (J point)
End: start of the T wave
T wave
Start: first deflection after the ST segment
End: return to baseline
QT interval
Start: start of the QRS complex
End: end of the T wave
RR interval
Start: peak of one R wave
End: peak of the next R wave
Beyond the Basics
The AV Node as a Gatekeeper
The atrioventricular (AV) node plays a vital regulatory role in cardiac conduction by controlling the timing of electrical impulses reaching the ventricles. This delay allows the atria to complete contraction and ventricular filling before ventricular depolarisation begins. Without this pause, atrial and ventricular contractions would overlap, significantly reducing cardiac efficiency and stroke volume.
Conduction through the AV node is inherently slower than through atrial or ventricular myocardium due to smaller cell size and fewer gap junctions. This physiological slowing makes the AV node particularly sensitive to changes in autonomic tone, ischemia, and pharmacological agents. Increased parasympathetic activity prolongs AV nodal conduction, while sympathetic stimulation shortens it, dynamically adjusting ventricular response to physiological demands.
AV Conduction Blocks and ECG Manifestations
When AV nodal conduction is delayed but intact, as in first-degree heart block, the ECG shows a prolonged PR interval without dropped beats. Although often asymptomatic, this finding reflects altered conduction and may worsen under increased vagal tone or with AV nodal blocking medications. It serves as an early indicator that the conduction system is vulnerable.
More advanced blocks involve intermittent or complete failure of conduction between the atria and ventricles. In second-degree heart block, some atrial impulses fail to reach the ventricles, producing irregular ventricular rhythms. Third-degree, or complete heart block, represents total dissociation between atrial and ventricular activity. In this setting, the ventricles rely on a slower escape rhythm, resulting in profound bradycardia and impaired cardiac output.
Bundle Branch Blocks and Ventricular Depolarisation
Once impulses pass through the AV node, rapid conduction through the His–Purkinje system ensures near-simultaneous activation of both ventricles. Bundle branch blocks disrupt this synchrony by slowing or blocking conduction through either the right or left bundle branch. As a result, one ventricle depolarises later than the other, prolonging ventricular activation.
On the ECG, this delayed depolarisation appears as a widened QRS complex with characteristic morphological changes depending on which bundle is affected. Although bundle branch blocks may be incidental findings, they can also reflect underlying structural heart disease, myocardial ischemia, or conduction system degeneration. Their presence alters the interpretation of other ECG features, particularly those related to ischemia.
ST Segment and T Wave Abnormalities
The ST segment and T wave represent ventricular repolarisation and are highly sensitive to disturbances in myocardial oxygen supply and cellular ion balance. In myocardial ischemia, reduced oxygen delivery alters transmembrane ion gradients, delaying repolarisation and producing ST depression or T wave inversion. These changes often evolve dynamically and may normalise with resolution of ischemia.
ST elevation indicates acute myocardial injury, where full-thickness ischemia disrupts normal electrical gradients across the ventricular wall. The degree and pattern of ST elevation provide clues to the location and extent of injury. Early recognition of these changes is critical, as they guide urgent reperfusion strategies and influence patient outcomes.
Electrolyte Disturbances and Repolarisation
Potassium plays a central role in determining the resting membrane potential and repolarisation of cardiac cells. Hyperkalaemia accelerates repolarisation, producing tall, narrow, peaked T waves and, in severe cases, progressive conduction slowing and arrhythmias. As potassium levels rise further, P waves may flatten or disappear, and the QRS complex may widen, signalling imminent electrical instability.
Hypokalaemia has the opposite effect, prolonging repolarisation and increasing myocardial excitability. This results in flattened T waves, ST depression, and the appearance of prominent U waves. These changes predispose the heart to ventricular arrhythmias, particularly in the presence of ischemia or digoxin therapy. Careful interpretation of these subtle ECG features allows clinicians to detect dangerous electrolyte imbalances before they progress to life-threatening events.
Integrating ECG Patterns in Clinical Context
ECG interpretation requires integration of conduction timing, waveform morphology, and clinical context. Changes rarely occur in isolation, and multiple abnormalities may coexist, particularly in critically ill patients. Understanding the physiological basis of these patterns enables clinicians to distinguish benign variations from early signs of deterioration.
By recognising how conduction delays, repolarisation abnormalities, and electrolyte disturbances shape the ECG, clinicians can identify evolving pathology and intervene promptly. This deeper understanding transforms the ECG from a static tracing into a dynamic reflection of cardiac physiology and pathophysiology.
Clinical Connections
ECGs are essential in diagnosing arrhythmias such as atrial fibrillation, supraventricular tachycardia, ventricular tachycardia, and complete heart block. In emergency settings, ECGs help confirm:
myocardial infarction
guide thrombolysis or angiography decisions
monitor for complications such as ventricular arrhythmias
recognise critical changes, and escalate concerns promptly
ECGs also guide medication use. For example, digoxin may cause characteristic ST changes, beta-blockers prolong PR interval, and many antiarrhythmic drugs risk prolonging the QT interval, increasing the chance of torsades de pointes. Electrolyte disturbances, particularly potassium and calcium imbalance, produce characteristic ECG changes that help guide urgent correction.
Concept Check
What electrical event does the P wave represent?
Why is the QRS complex sharp and pronounced?
What do ST elevation and depression indicate?
How do electrolyte disturbances affect ECG appearance?
What does a prolonged PR interval suggest?